Bitcoin price falls below $63K as fresh U.S.-Iran strikes hit markets
Bitcoin slipped below $63,000 on Friday as renewed U.S. military action against Iran added to a broader retreat from risk assets.
Summary
Bitcoin fell below $63,000 as renewed U.S.-Iran fighting and wider risk-off sentiment pressured markets Friday.
U.S. spot Bitcoin ETFs added $79.15 million Thursday, providing limited support during renewed geopolitical selling.
Technical levels place $65,000 as resistance while losing $62,200 could expose Bitcoin’s lower trading range.
According to crypto.news market data , BTC traded near $62,777, down 2.19% over 24 hours, after moving between $62,705 and $64,753.
The decline extended BTC’s pullback after sellers rejected prices near $65,000 earlier in the week. Asian equity markets also fell sharply on Friday, although a major selloff in technology and semiconductor stocks was a central driver of the broader market weakness. The MSCI Asia-Pacific index dropped 2.7%, while Japan and Taiwan recorded heavier losses.
Meanwhile, geopolitical pressure increased after the U.S. carried out another wave of strikes against Iran. The latest attacks targeted infrastructure and military-linked sites in southern Iran, including bridges and facilities near key ports. Iran also continued retaliatory attacks across parts of the Gulf region.
Fresh tension between Washington and Beijing added another source of uncertainty. President Donald Trump released intelligence and alleged Chinese interference connected to the 2020 U.S. election.
China denied the allegations, while previous U.S. intelligence assessments found no evidence that Beijing changed the election result. Markets are also watching whether the dispute affects Trump’s planned September meeting with Chinese President Xi Jinping.
Bitcoin traders watch $62,200 support and $65,000 resistance
Despite the latest decline, institutional flows offered some support. According to the SoSoValue figures provided for the July 16 session, U.S. spot Bitcoin ETFs recorded $79.15 million in net inflows, led by BlackRock’s IBIT with $33.44 million.
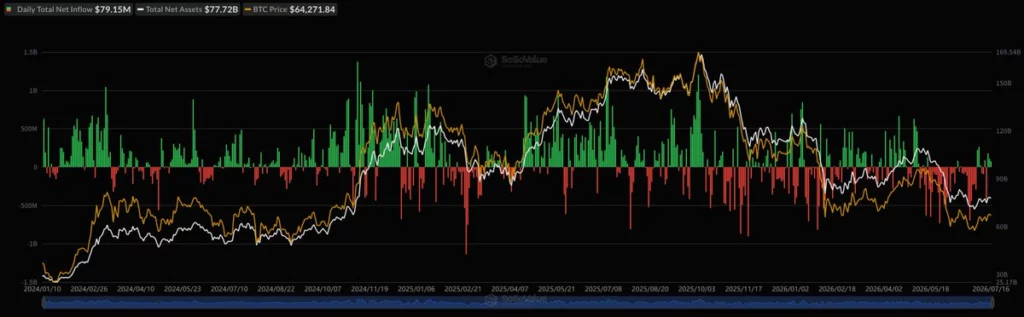
The inflows follow a period of uneven institutional demand. Bitcoin recently faced pressure from rising oil prices and renewed U.S.-Iran tensions while traders watched support around $62,000. That analysis identified resistance between roughly $63,100 and $64,700.
The latest technical setup remains mixed. The chart data provided for this report showed BTC below its nine-day simple moving average near $63,765, while the relative strength index stood at 47.74. That places momentum slightly below neutral without showing deeply oversold conditions.
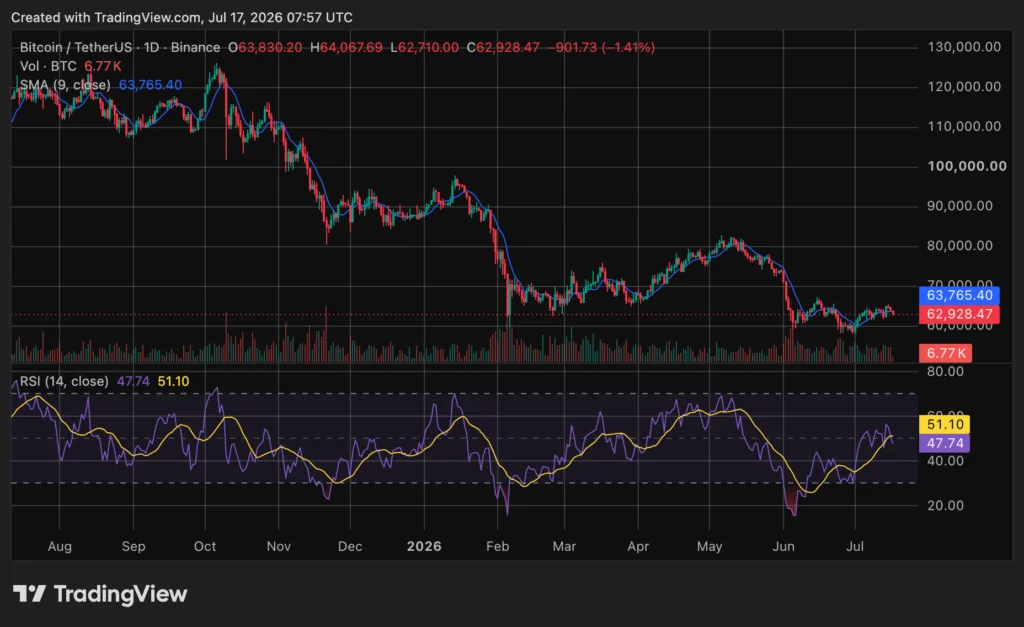
Bitcoin has also remained inside the broader $60,000–$65,000 range for more than a month. A sustained recovery above $64,000 and $65,000 would improve the short-term structure. However, another rejection from that area could keep the cryptocurrency locked inside its current consolidation range.
Analysts highlight key resistance and support levels
Crypto analyst Michaël van de Poppe said BTC’s broader setup remains constructive despite the latest correction. In his view, a clear breakthrough above $65,000 could open the way for stronger upside momentum.
Nothing changed on $BTC . It's looking great for upside momentum from here, even despite the recent correction. Clear breakthrough above $65K, and we're still going to see a strong run. pic.twitter.com/tT6YAakMsI
— Michaël van de Poppe (@CryptoMichNL)
Meanwhile, Ardi identified the $63,300–$63,800 region as an important trendline area and placed horizontal support near $62,200. He warned that losing both areas could signal that the current relief rally has ended.
Ali Charts offered a longer-term view based on Bitcoin’s previous market cycles. He noted that BTC has historically formed major bottoms about 12 months after major market peaks. If that pattern repeats, he said the next major bottom could emerge around October. However, historical cycles do not guarantee that Bitcoin will follow the same timeline again.
Historically, Bitcoin $BTC has bottomed roughly 12 months after each major market top. If that pattern holds, the next market bottom could form around October. pic.twitter.com/8oHc0jaUzs
— Ali Charts (@alicharts)
In addition, Crypflow also pointed to Bitcoin’s two-week MACD as a potential confirmation signal. The analyst noted that during the 2018 and 2022 bear markets, BTC had already reached its cycle bottom before the two-week MACD produced a bullish crossover. Based on that pattern, a future crossover could confirm an existing bottom rather than identify it in advance.
The asset is also moving through a large options settlement. As crypto.news reported earlier Friday, around $1.2 billion in BTC options expired with maximum pain near $63,000. The expiry came as Bitcoin remained inside the $60,000–$65,000 range that has contained price action for more than a month.
Disclosure: This article does not represent investment advice. The content and materials featured on this page are for educational purposes only.
Automated crypto news ingestion from CoinDesk.