How to Read Crypto Charts: A Beginner's Guide to Technical Analysis
I still remember staring at my first crypto chart. Green and red candles flashing across the screen, lines going up and down, numbers changing every second. I had no idea what I was looking at. And the worst part? I didn't know what I was supposed to be looking for.
You are not alone if that sounds familiar.
Learning how to read crypto charts is the single most important skill any trader can develop. Without it, you are trading blind. With it, you can identify trends, spot potential reversals, and make informed decisions about when to enter and exit positions.
Technical analysis is simply the study of past price movements to identify patterns and make informed decisions. It is not magic. It is not a crystal ball. It is a skill that anyone can learn with practice. This guide will walk you through the basics in plain English, with real examples and practical steps you can start using today.
Quick Answer: Learning how to read crypto trading charts is the foundation of technical analysis. The core idea is that market psychology, reflected in price action, tends to repeat over time. By learning to read candlestick charts, identify support and resistance levels, and understand key indicators like RSI and MACD, you can make more informed trading decisions. No single tool works every time. The best approach combines multiple tools with solid risk management.
If you are completely new, start with candlesticks. They are the building blocks of every crypto chart and the first thing you need to understand before moving on to anything else.
What Is Technical Analysis?
Technical analysis is the practice of using historical price data and trading volume to forecast future price movements. Unlike fundamental analysis, which looks at a company's earnings, assets, and business model, technical analysis focuses entirely on price action and the psychology of market participants.
The underlying assumption is that market prices already reflect all available information. Therefore, by studying price patterns and indicators, traders can identify opportunities based on how other traders are likely to behave.
Key principle: Price action reflects the collective psychology of all market participants. Patterns repeat because human behavior repeats. This is why learning how to read crypto charts is so valuable. You are essentially learning to read the collective psychology of the market.
Technical Analysis vs. Fundamental Analysis
Factor | Technical Analysis | Fundamental Analysis |
|---|---|---|
What it studies | Price action, volume, patterns | Earnings, assets, business models |
Time horizon | Short to medium term | Long term |
Data source | Charts and indicators | Financial statements, news |
Best for | Timing entries and exits | Valuing an asset's intrinsic worth |
Applicability | Any traded asset (crypto, stocks, forex) | Stocks, bonds, and companies |
The two approaches are not mutually exclusive. Many traders use fundamental analysis to decide which assets to trade and technical analysis to decide when to enter and exit.
Candlestick Charts: The Foundation
If you have ever looked at a crypto chart, you have likely seen candlesticks. They look like small rectangles with lines sticking out of the top and bottom. They are the most common way to display price data because they show more information than a simple line chart.
Candlestick charts are the foundation of how to read crypto charts. Without understanding candlesticks, nothing else will make sense. They are the language of price action.
Anatomy of a Candlestick
A single candlestick shows four pieces of information for a specific time period:
Element | What It Tells You |
|---|---|
Open | The price at the beginning of the period |
High | The highest price reached during the period |
Low | The lowest price reached during the period |
Close | The price at the end of the period |
The "body" of the candle represents the range between open and close. The "wicks" or "shadows" show the high and low.
Bullish vs. Bearish Candlesticks
A bullish candle (typically green or white) closes higher than it opened. This means buyers were in control during that period.
A bearish candle (typically red or black) closes lower than it opened. This means sellers were in control.
Common Candlestick Patterns
Pattern | What It Signals |
|---|---|
Doji | The open and close are nearly equal. Signals indecision or potential reversal |
Hammer | A small body with a long lower wick. Appears at bottoms. Signals potential reversal up |
Shooting Star | A small body with a long upper wick. Appears at tops. Signals potential reversal down |
Engulfing | A large candle completely engulfs the previous candle's body. Strong reversal signal |
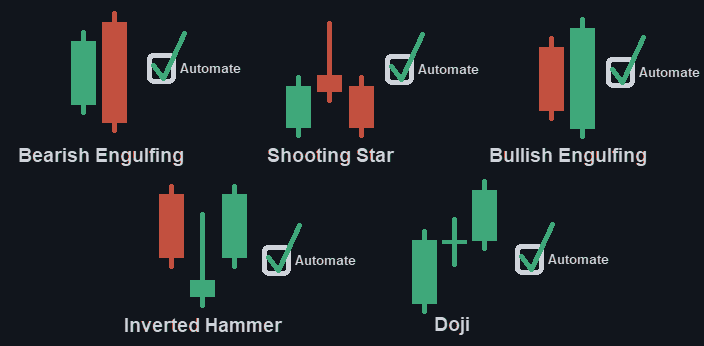
These patterns are not guaranteed. They are signals that suggest a change in momentum may be coming. When you learn how to read crypto charts, you learn to recognize these patterns quickly.
Timeframes: Choosing Your Lens
How to read crypto charts depends partly on your timeframe. Technical analysis can be applied to any timeframe. The choice depends entirely on your trading style.
Common Timeframes
Timeframe | Best For |
|---|---|
1-minute to 15-minute | Scalping (very short-term trades) |
1-hour to 4-hour | Day trading |
Daily | Swing trading (holding for days or weeks) |
Weekly | Position trading (holding for months) |
Monthly | Long-term trend analysis |
The longer the timeframe, the more significant the price levels. A support level on the weekly chart carries more weight than a support level on the 15-minute chart. Always analyze trends on a higher timeframe before making decisions on a lower one.
If you are learning how to read crypto charts for day trading, focus on 1-hour to 4-hour charts. If you are learning for longer-term investing, start with daily and weekly charts.
Support and Resistance: The Core of Chart Reading
Support and resistance are the most important concepts in technical analysis. They form the foundation for nearly every other technique and are essential to understanding how to read crypto market charts.
What Is Support?
Support is a price level where demand is strong enough to prevent the price from falling further. Think of it as a floor. When price approaches support, buyers tend to step in, expecting the price to bounce higher.
What Is Resistance?
Resistance is a price level where selling pressure is strong enough to prevent the price from rising further. Think of it as a ceiling. When price approaches resistance, sellers tend to step in, expecting the price to reverse lower.
How to Identify Support and Resistance
Look for areas where price has reversed multiple times. A horizontal line connecting these reversal points creates a support or resistance level.
Key insight: Support and resistance often flip roles. When price breaks above resistance, that level can become new support. When price breaks below support, that level can become new resistance.
The Role of Trading Volume
Volume confirms the strength of a breakout. A breakout on low volume may be a false signal. A breakout on high volume suggests genuine conviction. In a downtrend, volume tends to increase on down days. In an uptrend, volume tends to increase on up days. Rising volume on a breakout adds confidence.
Trend Lines and Channels
Trend lines are straight lines drawn on a chart to connect successive highs or lows. They help visualize the direction of the market.
Types of Trends
Trend | Description |
|---|---|
Uptrend | Higher highs and higher lows. Draw trend line beneath the lows |
Downtrend | Lower highs and lower lows. Draw trend line above the highs |
Sideways (Range) | Price moves between support and resistance without clear direction |
Drawing Trend Lines Correctly
Connect at least two significant points. The more touches a trend line has, the more significant it is. A line with three or more touches is considered a valid trend line. A breakout through a trend line can signal a trend reversal.
Key Technical Indicators for Beginners
Indicators are mathematical calculations based on price and volume. They help traders identify momentum, overbought or oversold conditions, and potential reversal points. If you are learning how to read crypto charts for beginners, start with these three indicators.
Moving Averages (MA)
Moving averages smooth out price data to help identify the direction of the trend. They remove the noise of daily price fluctuations.
Simple Moving Average (SMA): The average price over a specific number of periods.
Exponential Moving Average (EMA): Gives more weight to recent prices. Responds faster to price changes.
Moving Average | Common Use |
|---|---|
20-period | Short-term trend |
50-period | Medium-term trend |
200-period | Long-term trend, often used as a bull/bear market indicator |
Golden Rule: When the 50-period MA crosses above the 200-period MA, it is called a "golden cross" and is considered bullish. When the 50-period MA crosses below the 200-period MA, it is a "death cross" and is considered bearish.
Relative Strength Index (RSI)
RSI measures the speed and change of price movements on a scale from 0 to 100.
RSI | Reading Meaning |
|---|---|
Above 70 | Overbought. The asset may be due for a pullback |
Below 30 | Oversold. The asset may be due for a bounce |
50 | Neutral. No strong bias |
RSI is useful for identifying potential reversals and confirming trends. Divergence between RSI and price can also be a strong signal. When price makes a higher high but RSI makes a lower high, momentum is weakening.
Moving Average Convergence Divergence (MACD)
MACD shows the relationship between two moving averages. It consists of a fast line (MACD line), a slow line (signal line), and a histogram.
When the MACD line crosses above the signal line, it is bullish.
When the MACD line crosses below the signal line, it is bearish.
The histogram shows the distance between the two lines.
MACD works best in trending markets and can produce false signals in sideways markets.
Volume
Volume is the number of units traded during a specific period. It is not strictly an indicator, but it provides essential context for other signals.
High volume confirms price moves and breakouts.
Low volume suggests a move may lack conviction.
Increasing volume on an uptrend confirms strength.
Increasing volume on a downtrend confirms selling pressure.
Understanding market metrics like volume and market cap helps confirm what you see on the charts. Learn to read crypto market metrics.
Common Chart Patterns to Know
Chart patterns are specific formations that appear on price charts. They often signal a continuation or reversal of the current trend.
Continuation Patterns
Pattern | Description | Signal |
|---|---|---|
Flags | Price consolidates in a tight range after a strong move | Trend likely to continue |
Pennants | Similar to flags, but the consolidation narrows to a point | Trend likely to continue |
Symmetrical Triangle | Price converges between two converging trend lines | Breakout in either direction |
Reversal Patterns
Pattern | Description | Signal |
|---|---|---|
Head and Shoulders | Three peaks, the middle peak is the highest | Bullish to bearish reversal |
Inverse Head and Shoulders | Three troughs, the middle trough is the lowest | Bearish to bullish reversal |
Double Top | Price hits resistance twice and fails to break | Bullish to bearish reversal |
Double Bottom | Price hits support twice and fails to break | Bearish to bullish reversal |
These patterns are more reliable when confirmed by volume. A head and shoulders reversal on high volume is stronger than one on low volume.
The Golden Rule of Technical Analysis
The single most important rule in technical analysis: never rely on a single indicator alone.
Every tool has blind spots. RSI can stay overbought in a strong uptrend for weeks. Moving averages can give late signals. Support and resistance levels can break without warning.
Always combine multiple tools:
Price action and trend structure
At least one momentum indicator (RSI or MACD)
Volume confirmation
Support and resistance levels
Risk management (position sizing and stop-losses)
Combining Indicators for Better Signals
A Practical Example
A common combination that can produce stronger signals:
Identify the trend using a 200-period moving average.
Find a support level where price has bounced before.
Check RSI to see if the asset is oversold (below 30).
Look for a bullish candlestick pattern like a hammer.
Wait for volume confirmation on the bounce.
When multiple indicators align, the signal is stronger.
Checklist for a High-Probability Setup
Factor | What to Look For |
|---|---|
Trend | Aligns with your intended direction |
Support/Resistance | Price is at a key level |
RSI | Confirms overbought or oversold condition |
MACD | Shows momentum in your direction |
Volume | Confirms the move |
Risk-Reward | Ratio is at least 2:1 |
Stop-Loss | Set at a logical level just beyond support/resistance |
Common Mistakes in Technical Analysis
Overcomplicating charts. Adding too many indicators makes charts confusing. More indicators do not mean better analysis. Two to three indicators are usually enough.
Ignoring the higher timeframe. A bullish signal on the 1-hour chart is less meaningful if the daily chart shows a strong downtrend.
Using indicators in the wrong market conditions. MACD works best in trending markets and can give false signals in sideways conditions. RSI is most useful in range-bound markets.
Chasing price without confirmation. Buying immediately at a resistance breakout can lead to catching a false breakout.
Forgetting to manage risk. Technical analysis improves entry and exit timing. It does not guarantee profitable outcomes. Always set a stop-loss and never risk more than you can afford to lose on a single trade.
Technical analysis is most effective when paired with solid risk management. See how leverage amplifies both gains and losses.
Tools for Live Crypto Charts
If you are looking for the best live crypto charts, several platforms offer excellent tools for technical analysis.
Platform | Best For | Key Features |
|---|---|---|
TradingView | Most comprehensive | Custom indicators, drawing tools, social features, multiple timeframe views |
CoinGecko | Quick price checks | Easy-to-read charts, basic indicators, market cap data |
CoinMarketCap | Market overview | Simple charts, volume data, price history |
Binance | Exchange-native | Integrated charts, order book data, live trading |
Kraken | Advanced trading | Professional charts, multiple order types, real-time data |
For crypto charts live with real-time data, TradingView is the most widely recommended option among professional traders. For crypto live charts with basic indicators, CoinGecko and CoinMarketCap are good starting points.
Where This Fits on TradeMesa
Learning how to read crypto trading charts is a foundational skill that supports every other trading decision. TradeMesa's content library covers the tools and strategies you need to build a complete trading process.
TradeMesa's verified analysts apply technical analysis alongside other tools before publishing a signal. Every analyst is independently verified, and every signal carries a permanent, public track record.
Want to see how market structure and patterns show up in real-time? Follow →
Frequently Asked Questions about Crypto Chart Analysis
How do I start learning to read crypto charts?
Start with candlestick patterns. They are the building blocks of every crypto chart. Then learn support and resistance. These two concepts form the foundation for everything else. Practice identifying them on real charts before adding indicators.
Is technical analysis reliable for crypto?
Technical analysis can be useful for crypto trading, but it is not a guarantee. Crypto markets are volatile and can react unpredictably to news. Technical analysis is most effective when combined with risk management and market awareness.
Do I need to learn all the indicators?
No. Start with two or three core tools: support/resistance, moving averages, and RSI. Once you understand these, you can explore others. Too many indicators often create confusion rather than clarity.
What is the best timeframe for technical analysis?
It depends on your trading style. Scalpers use 1- to 15-minute charts. Day traders use 1-hour to 4-hour charts. Swing traders use daily charts. Always check the higher timeframe first.
How do I set a stop-loss using technical analysis?
Place your stop-loss just beyond a key support or resistance level. For a long trade, place it below a recent swing low or support. For a short trade, place it above a recent swing high or resistance.
What is a golden cross?
A golden cross occurs when the 50-period moving average crosses above the 200-period moving average. It is considered a bullish signal that the asset may be entering a long-term uptrend.
What is the difference between a flag and a pennant?
A flag is a consolidation pattern that forms after a strong move, with parallel trend lines. A pennant is similar but the consolidation narrows to a point, forming a triangle shape. Both are continuation patterns.
Can I trade crypto without learning technical analysis?
Yes, but it is more difficult. Trading without understanding price action and market structure is closer to gambling than informed trading. Learning how to read crypto charts for beginners can significantly improve your decision-making.
This article is for informational and educational purposes only and does not constitute financial or security advice. Crypto assets involve significant risk, including the possible loss of funds. Always verify current wallet, custody, security, and regulatory information before using a crypto service. Full Risk Disclaimer →
The TradeMesa Editorial Team consists of experienced writers, researchers, and trading specialists who create and review educational content covering crypto and forex markets, trading strategies, risk management, and platform guides. Our content is researched, fact-checked, and regularly reviewed to maintain accuracy and relevance.